Google Search Console (GSC) is one of the most powerful free SEO tools available. Yet for many website owners, its dashboard can feel overwhelming—filled with charts, technical terms, and reports that seem to speak a different language. If you’ve been avoiding GSC, you’re missing out on direct signals from Google about how your site performs in search.
This guide is designed for total beginners. We’ll walk through every major report inside Search Console, explain what it means in plain English, and show you how to find quick SEO wins that can increase your traffic—often in the same month.
Step 1: Setting Up Google Search Console
If you haven’t yet added your site to Search Console, do it now. It only takes five minutes.
- Go to search.google.com/search-console and sign in with your Google account.
- Click “Add Property” and choose either Domain (recommended – covers all subdomains and protocols) or URL prefix (easier if you can’t modify DNS).
- Verify ownership. For Domain, you’ll typically add a TXT record to your DNS. For URL prefix, you can use an HTML file upload, HTML tag, Google Analytics, or Google Tag Manager. Most managed WordPress hosts offer one‑click verification via a plugin.
- After verification, wait a day or two for data to start populating. You can submit your sitemap right away to speed up indexing.
Once verified, you’ll land on the Overview page. Let’s decode what you see.
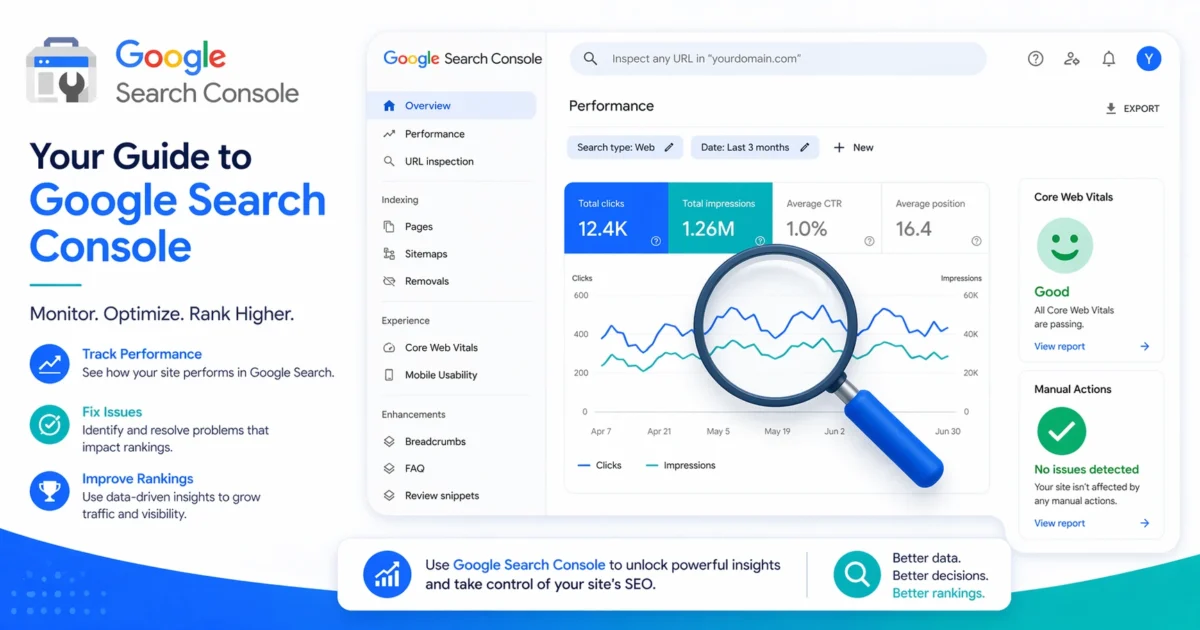
The Performance Report: Your Daily SEO Dashboard
The Performance report is where you’ll spend most of your time. It shows how often your site appears in Google Search results, how many clicks you get, and your average ranking position.
Four key metrics are displayed:
| Metric | What It Means |
|---|---|
| Total Clicks | How many times users clicked through to your site from search results. |
| Total Impressions | How many times a link to your site appeared in search results (even if not clicked). |
| Average CTR | Clicks divided by impressions. A low CTR might mean your title tags or meta descriptions aren’t compelling. |
| Average Position | Your average ranking position for a given query. Position 1 is the top; position 10 is bottom of page 1. |
You can filter by date range, queries, pages, countries, devices, and search appearance (like rich results). Use these filters to narrow down exactly which pages and keywords are driving traffic—or where you’re almost there.
Finding Quick‑Win Keywords (Pages Ranking on Page 2–4)
One of the most underused features: identifying queries where you rank between positions 8 and 20. These are already generating impressions, but you’re invisible because nobody scrolls that far.
How to find them:
- In the Performance report, click + New → Query.
- Sort by Impressions (descending).
- Now apply a position filter: click Position and set the range from 8 to 20 (or even 6 to 15).
- You’ll see queries that Google already associates with your page but ranks too low.
- Pick the top 5–10 by impressions. Then improve the corresponding page: add more depth, update the title tag, improve internal links from other relevant articles.
Often, a small refresh pushes these queries onto page one, and traffic can double or triple within weeks.
The URL Inspection Tool: Diagnose a Single Page
Enter any URL from your site into the search bar at the top of GSC. The URL Inspection tool tells you:
- Indexing status: Is the page in Google’s index? If not, why?
- Last crawl date: When Google last visited the page.
- Canonical URL: Which URL Google considers the primary version.
- Mobile Usability: Any issues on mobile devices.
- Structured Data: Schema that Google detected (or errors if broken).
- Page Experience: Core Web Vitals status for this specific page.
After making fixes to a page, you can click “Request Indexing” to ask Google to re‑crawl it. This is gold after updating old content or fixing technical issues.
The Page Experience & Core Web Vitals Report
This report shows how your pages perform on real‑world user experience metrics: LCP (loading), INP (interactivity), and CLS (visual stability). Google defines “Good,” “Needs Improvement,” and “Poor” thresholds.
If you see URLs in the “Poor” category, they’re actively hurting your rankings. Click into the report to find the specific issues (e.g., slow server response, render‑blocking resources, layout shifts) and follow the fix recommendations. Most problems can be solved with better caching, image optimization, and removing heavy scripts—topics we cover in our WordPress Speed Killers and Core Web Vitals guides.
Sitemaps: Help Google Discover Your Content
Under the Sitemaps report, you can submit your XML sitemap (e.g., /sitemap.xml). This tells Google about all your important pages and how they’re structured. After submission, Google will periodically check it for new content.
Check back here weekly to see how many pages were discovered vs. actually indexed. A large gap may indicate crawl budget issues, duplicate content, or thin pages that Google deems not useful.
The Links Report: Who Links to You?
GSC provides a basic but useful view of your backlink profile. It shows:
- External links: Which domains link to your site and which pages they link to.
- Internal links: Your most linked‑to pages (important for understanding your site’s structure).
- Top linking text: The anchor text used in external links—should be varied and natural.
While not as comprehensive as paid tools like Ahrefs, the GSC Links report is free and shows how Google sees your link profile. Use it to spot unnatural linking patterns or undervalued content that deserves more internal links.
Security & Manual Actions
This section alerts you to serious problems: if your site has been hacked, contains malware, or if a Google reviewer has applied a manual penalty for violating guidelines. If you see nothing here, you’re in good shape. If you do, resolve it immediately—manual actions can tank your rankings overnight.

🛠️ Don’t forget to check out our free SEO and performance tools – they complement Search Console data by giving you instant feedback on title tags, meta descriptions, and on‑page optimization.
Turn GSC Data into Action
Search Console isn’t just for looking—it’s for doing. Here’s a simple weekly routine:
- Monday: Check the Performance report for any sudden drops or spikes in clicks/impressions. Investigate surprises.
- Wednesday: Review the Page Experience report. Pick one “Poor” page to optimize.
- Friday: Look at the “Queries” table, filter for positions 8–20, and plan content updates for next week.
Even 15 minutes a week with Search Console will surface improvements that many site owners ignore.
Want a second opinion on your site’s health? Run our Free SEO Audit Tool for a complete breakdown of your title tags, meta descriptions, speed issues, and more—then compare it with what you see in Search Console.